Abstract
We propose using Ensemble Learning to improve Cluster Analysis accuracy by combining multiple models.
Our project aims to enhance clustering accuracy for datasets with related and non-related attributes.
By applying Ensemble Learning techniques, we can uncover hidden patterns and improve real-world clustering applications.
Cluster Analysis
-
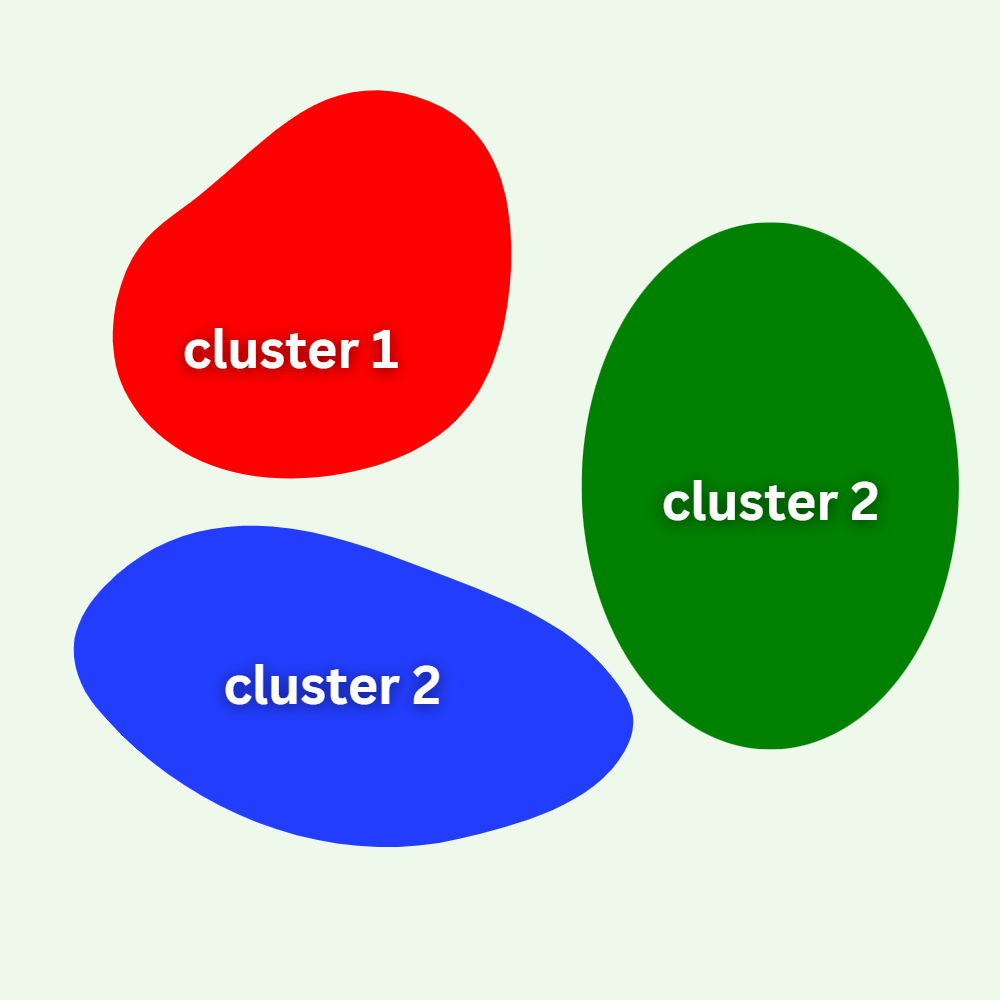
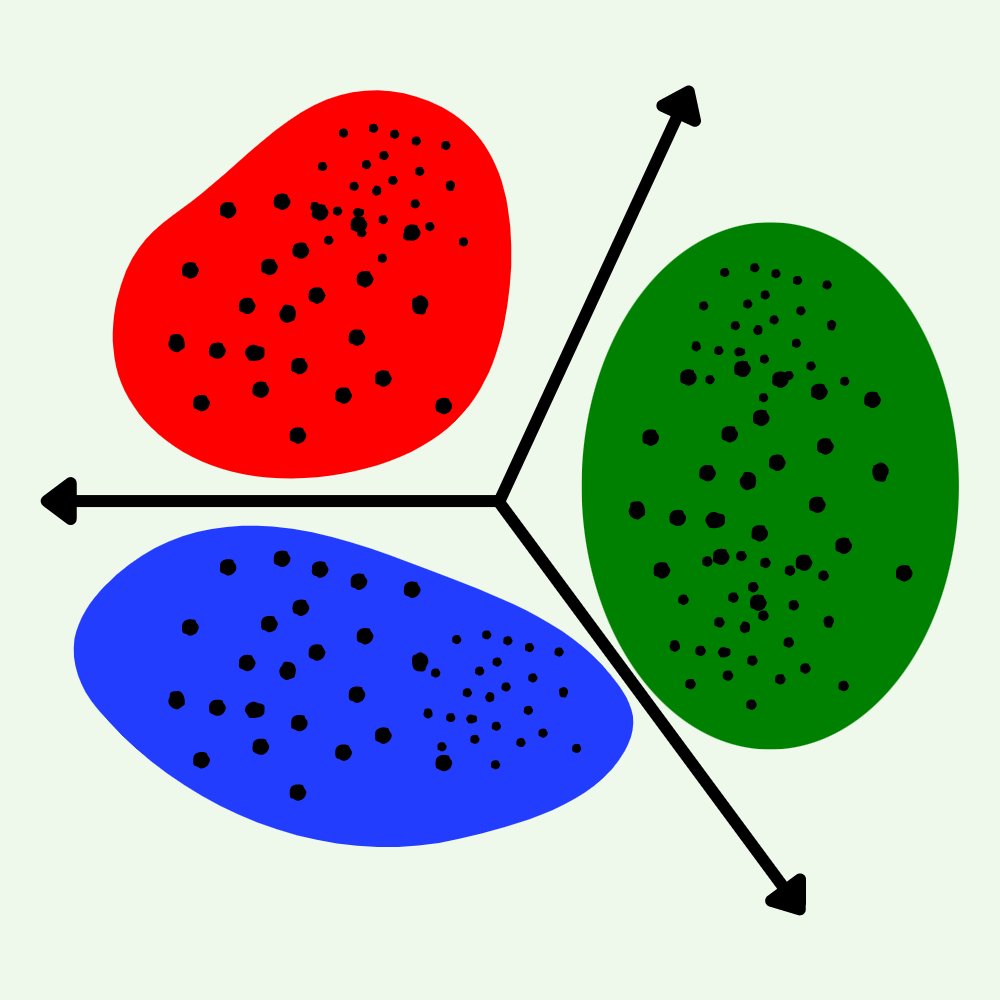
Clustering groups similar data points together without relying on pre-defined labels.
-
It uncovers hidden patterns and structures in data that may not be immediately apparent.
-
Clustering simplifies complex data sets by reducing variables, aiding in analysis and trend identification.
-
It enhances the performance of other machine learning algorithms by reducing noise and improving accuracy.
Ensemble Clustering
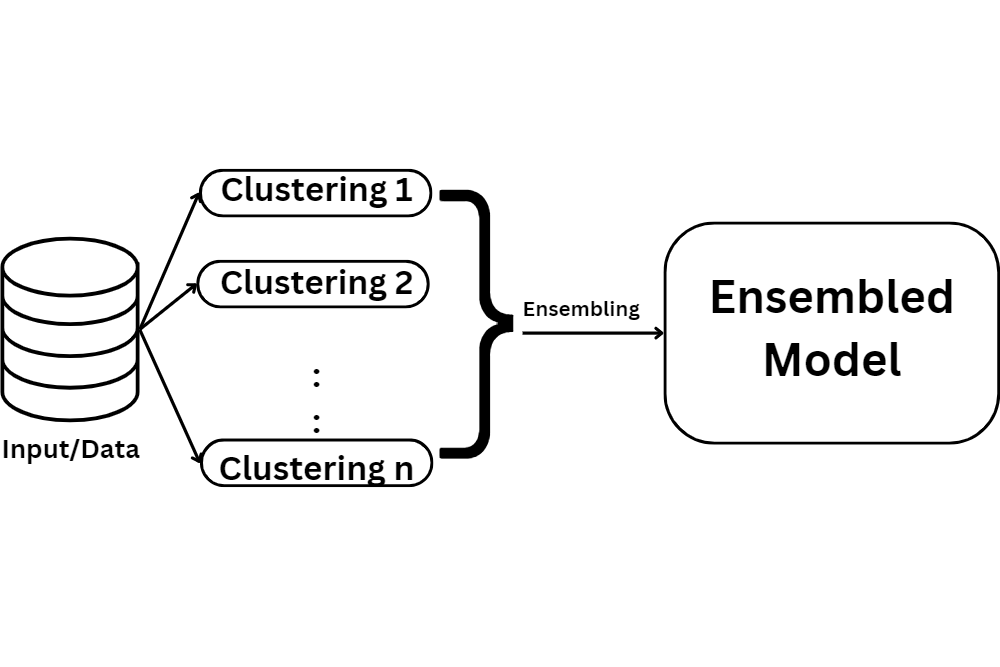
Ensemble clustering combines multiple algorithms for more accurate and robust clustering results.
It improves stability, reliability, and accuracy of clustering, particularly for complex data sets with noise or outliers.
Applications include image analysis, text mining, and bioinformatics, where traditional clustering techniques struggle with large, high-dimensional data sets.
-
Ensemble clustering aids in determining the optimal number of clusters and uncovers valuable insights missed by individual algorithms.